Track your tweets, which one worked better?
Do you know what kind of content works better for you on Twitter? Which one of your tweets got the highest number of retweets or favorites? You can check it out with Daily Metrics, your Twitter metrics everyday in your mailbox.
First, you need to signup for Daily Metrics and then setup a connector for Twitter Timeline. Connectors are short scripts that will connect on your behalf to your data source (in this case, Twitter) and extract your key metrics.
To setup a Twitter Timeline connector, go to the Connectors page, find the Twitter Timeline connector and click on Add to my project. You will then see a settings page, where you can give a name to this connector (ie, twitter_timeline) and then you can write the Twitter username you want to follow (it could be yourself or any other user)
Click on Save and you are all set, you have a running Twitter Timeline connector that will send you your key metrics every day.
Once you have a running connector, we need to show the data on the email, which we can do by editing the email template. It's as easy as adding this short code to your template:
{{{ twitter_timeline({ name: 'twitter_timeline', title: 'My tweets'}) }}}
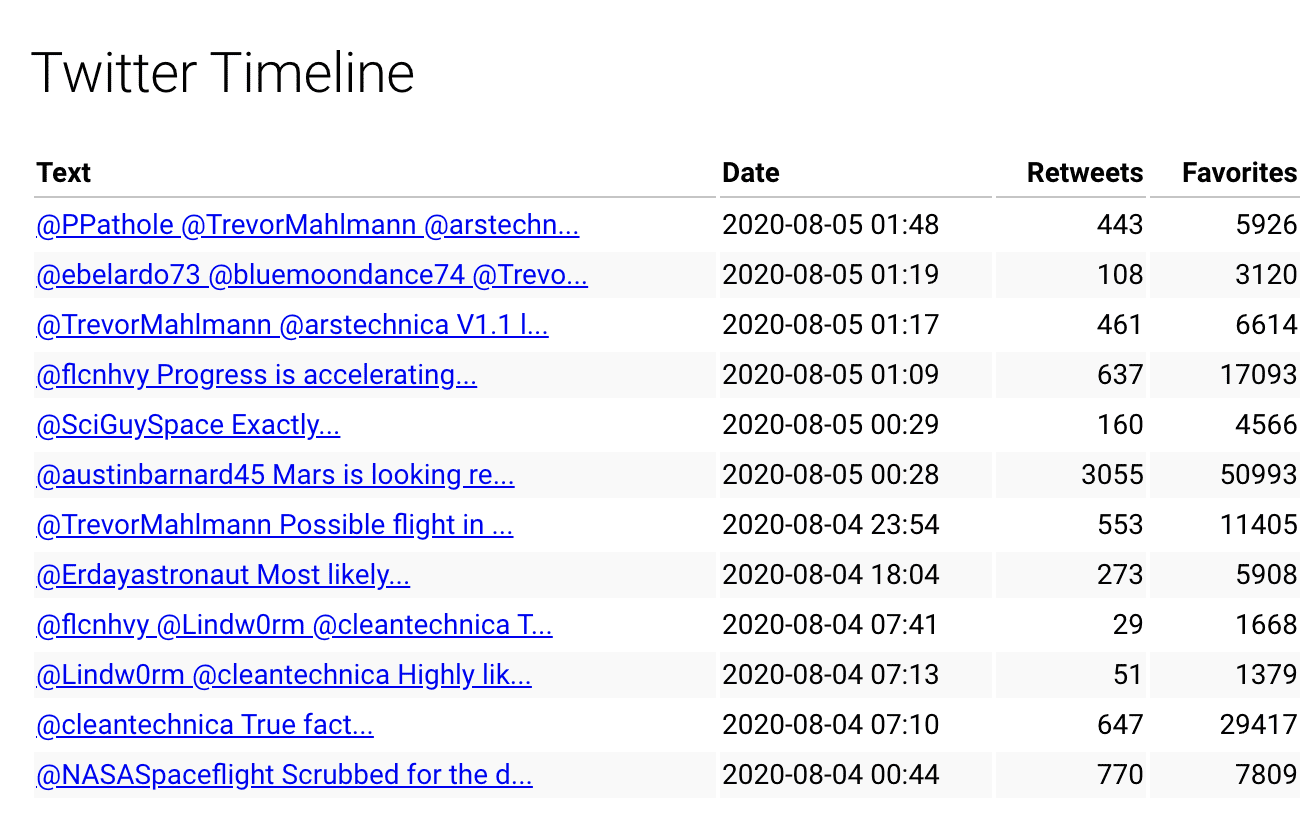
That's it, we now have a table with the latest tweets and their engagement, and with Daily Metrics you will find it in your mailbox every day.
If you liked this, try it out today and get your key metrics in a beautiful daily email!